What we found
Five findings, and how sure we are about each
1
In blue light, amyloid-positive retinas look slightly more heterogeneous
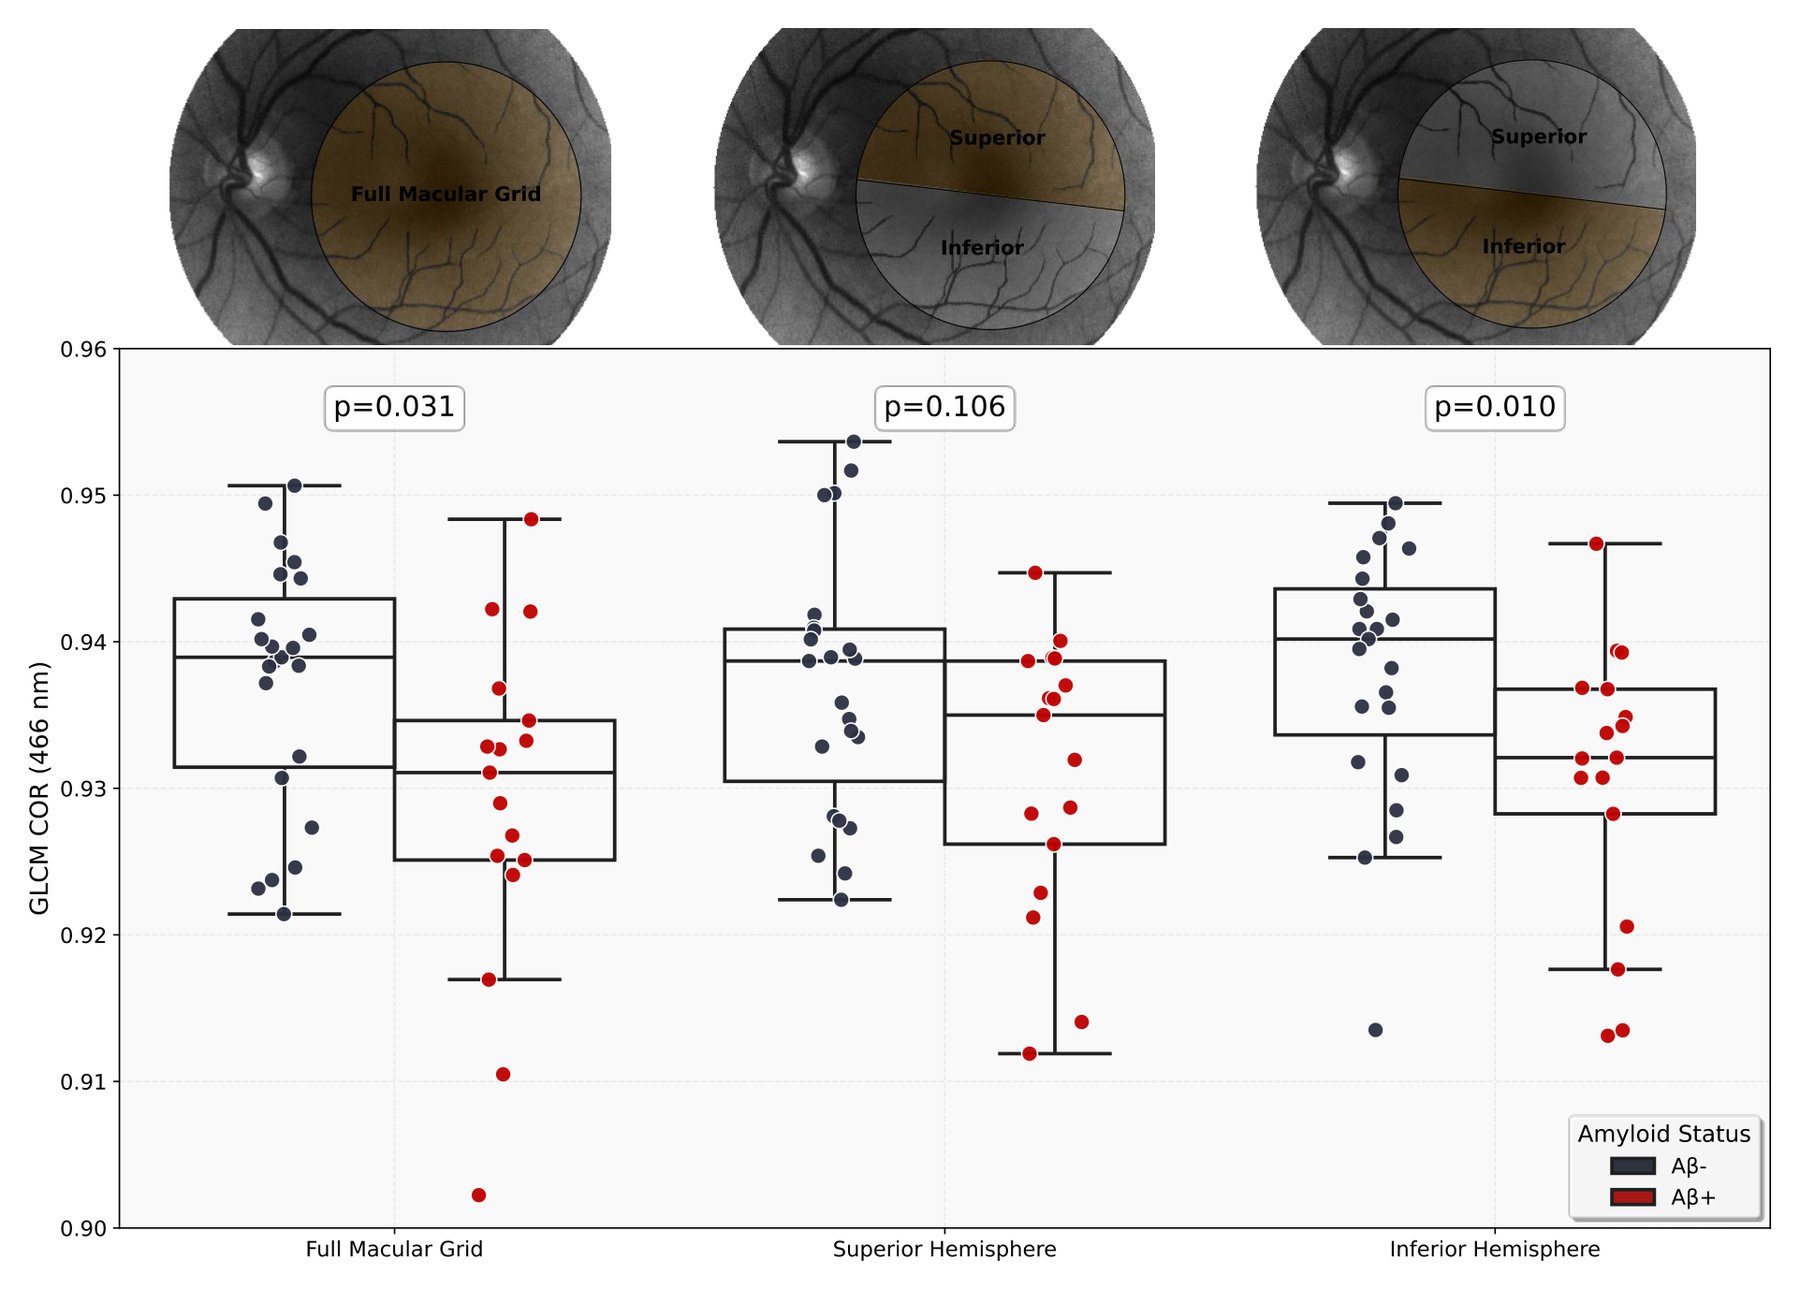
Across all colour bands and regions, the strongest candidate signal was GLCM correlation at 466 nm, the shortest (bluest) wavelength we analysed. Amyloid-positive participants had lower values, meaning a more heterogeneous local texture. The difference was clearest in the lower (inferior) half of the macula, where texture alone separated the groups with an AUC of 0.72.
Why blue? Shorter wavelengths scatter more strongly off very small structures in tissue. Earlier studies, in Alzheimer's mouse models and in patients, also reported the largest retinal optical changes at short wavelengths, below about 500–565 nm.
How sure are we?
This was an exploratory screen: we compared 14 wavelengths × 3 regions = 42 combinations. After correcting for that many comparisons, none of them remained statistically significant. And because 466 nm was picked using the whole dataset, the performance estimate is optimistic: when we let the model pick its wavelength inside each cross-validation fold, the full-macula AUC dropped from 0.69 to 0.52 (and in the inferior half only from 0.72 to 0.68). Encouragingly, 466 nm was still the wavelength chosen most often (in 97.5% of folds for the inferior half).
Also, texture is an optical measure, not a chemical one: these data don't tell us that we are literally seeing amyloid in the retina. Tau, inflammation, or other tissue changes could contribute as well.
We also checked how stable the measurement is. Repeating the scan with different flash settings on the same day gave very consistent values (ICC up to 0.88). Across visits months apart, repeatability was moderate (ICC 0.60 for the full macula).
2
The ganglion cell layer carries a structural signal, spread across the macula
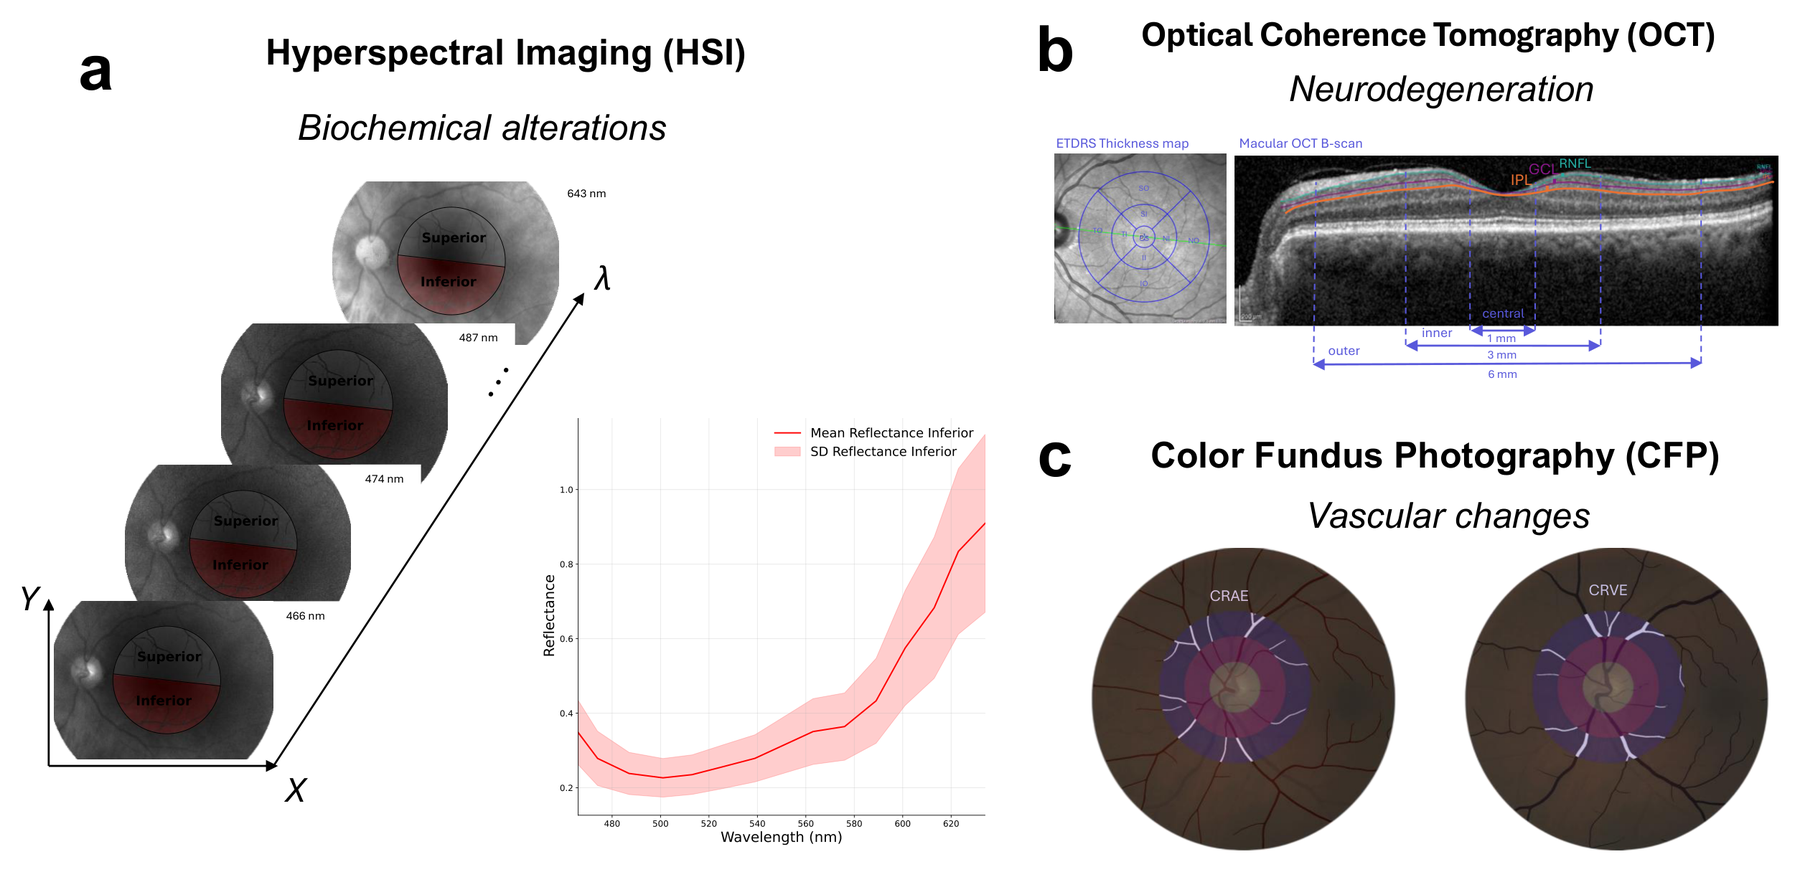
On OCT, the overall pattern of GC-IPL thickness across the nine macular regions was associated with amyloid status (p = 0.009, adjusted for age and sex). The nerve fibre layer (RNFL) was not. Interestingly, no single region differed significantly on its own: the information lies in the spatial pattern, not in one spot.
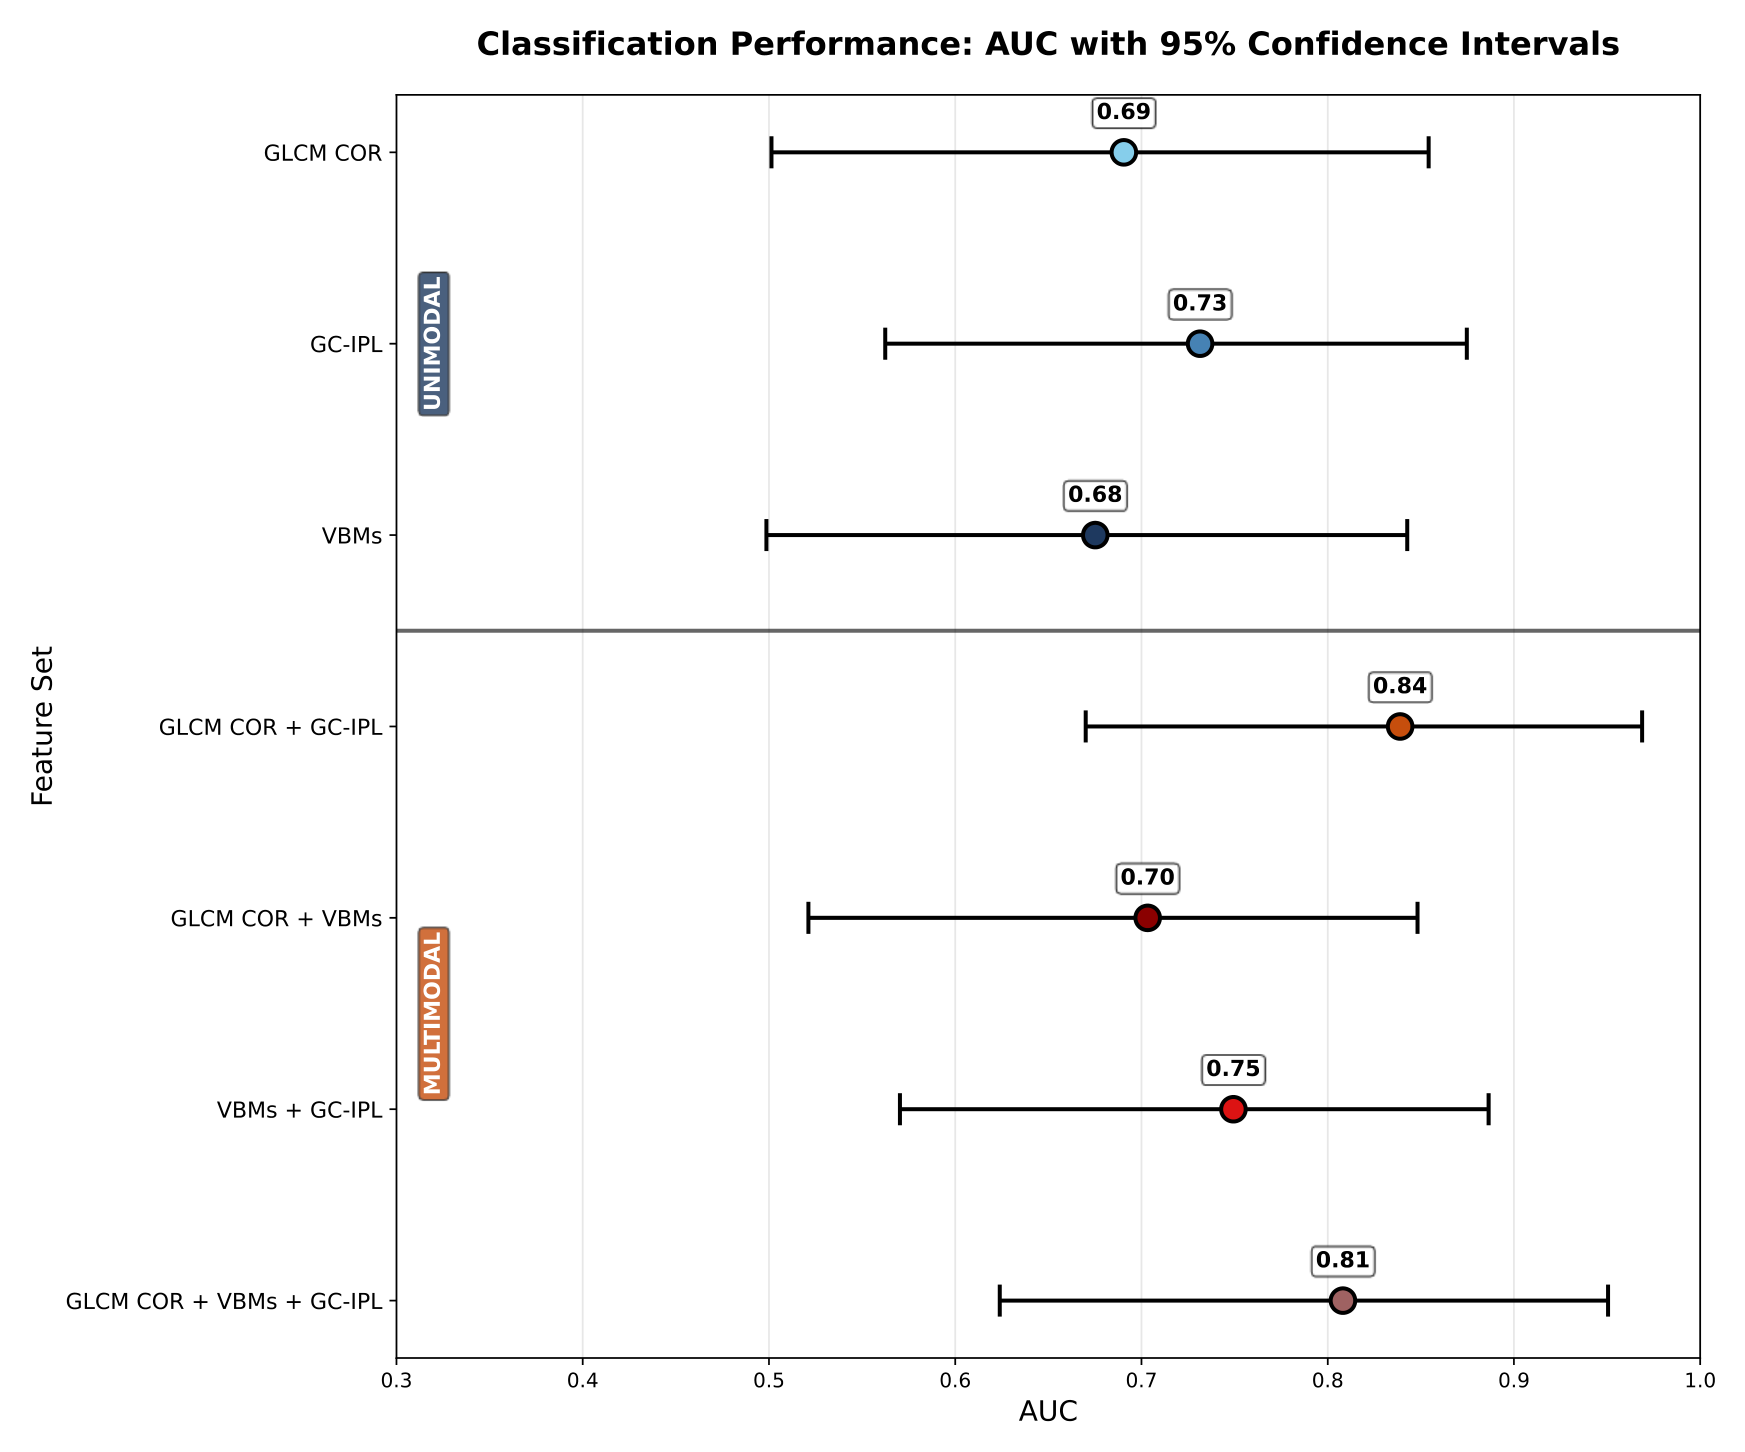
A model using all nine GC-IPL regions reached an AUC of 0.73. And, like HSI, the inferior regions were far more informative than the superior ones (AUC 0.71 vs. 0.45). Two very different techniques pointing at the same part of the retina is intriguing. Since both were measured in the same people, though, it is a convergence worth following up, not an independent replication.
3
Large retinal vessels added little
Of 24 vascular measures, only arteriole width (slightly wider in Aβ+) and the number of venous endpoints showed nominal differences, and neither survived correction for multiple comparisons. Arteriole and venule width together gave an AUC of 0.68, and adding them to the best model did not help (0.84 → 0.81).
That doesn't mean blood vessels are irrelevant in Alzheimer's. Static vessel width on a photo is a coarse measure, and vessel width is also strongly affected by blood pressure, diabetes and heart disease. Changes at the level of the tiniest capillaries (measurable with OCT angiography) or in how vessels react (dynamic vessel analysis, now being collected in RetAD) may be more sensitive.
4
Combining texture and structure gave the best performance
The strongest model combined HSI texture with the nine OCT GC-IPL regions. How to read the numbers:
How sure are we?
Every model did better than chance (tested by shuffling the labels 1,000 times; p = 0.001 for HSI + OCT). But the confidence intervals are wide, as expected with 40 people. The gain of the combination over HSI alone (+0.15, 95% CI −0.01 to 0.30) or over OCT alone (+0.11, −0.04 to 0.25) was not statistically significant. The right reading is: the two techniques seem to carry complementary information, which is a hypothesis worth testing at scale, not yet proof that combining them is better.
5
Across disease stages, the texture signal dips and then rises again
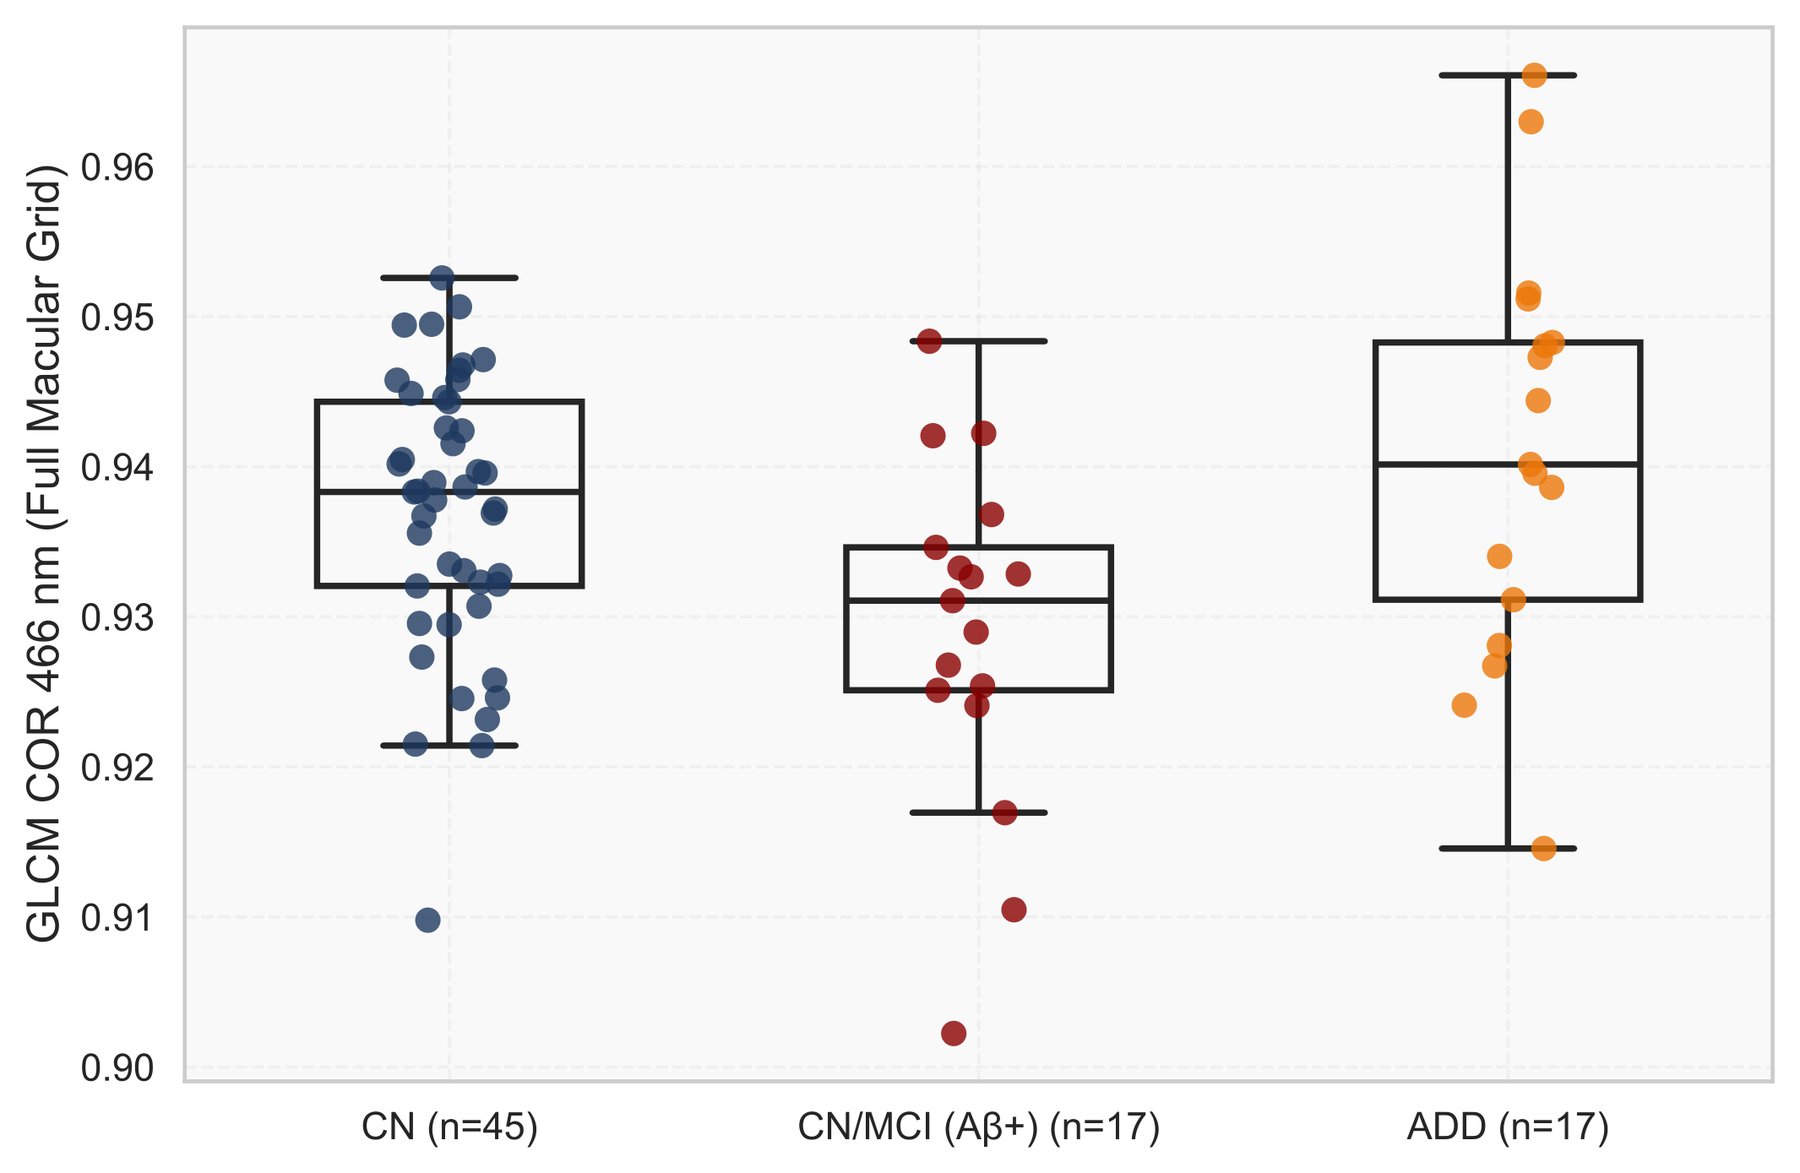
To look beyond the early stage, we added 39 participants from our earlier study (22 cognitively normal, 17 with Alzheimer's dementia), imaged with the same camera. Texture was lower in the early amyloid-positive group than in controls, but in people with dementia it was back up, not different from controls.
A similar "strongest in the middle" pattern was reported in an earlier hyperspectral study, whose authors suggested that small, soluble amyloid clusters early in the disease may affect light differently from the larger, fibrillar aggregates found later. That could explain our pattern too, but it remains a hypothesis. It also has a practical implication: a marker that goes down and then back up cannot simply be read as "lower is worse".
How sure are we?
These are different people at different stages, not the same people followed over time, and the dementia group came from a separate cohort. Controls from both cohorts had similar values (p = 0.503), which is somewhat reassuring, but stage and cohort remain partly entangled. Only longitudinal follow-up can show whether this is how the retina actually changes over the course of the disease.